


![]() Manager |
Manager | ![]() Partner
Partner
Overview
At your Project page, select ![]()
Users can compare metrics across different periods and namespaces without the need for extensive command-line knowledge by using Prometheus queries (PromQL). It helps monitor resource utilization, enabling effective capacity planning and allocation.
The Dashboard is available for your Project if monitoring is enabled. You can read more about monitoring here.
At least four nodes are required. Read more details about cluster creation here.
Taikun Tab
On Cluster Dashboard you can find:
- Node Overview: Display information about cluster nodes, such as CPU and memory utilization, pod count, and other relevant metrics.
- Pod Overview: Show the status of pods within the project, including their current state, restart counts, and resource usage.
- Overcommitment: CPU and Memory overcommit.
You can define a specific time range

General
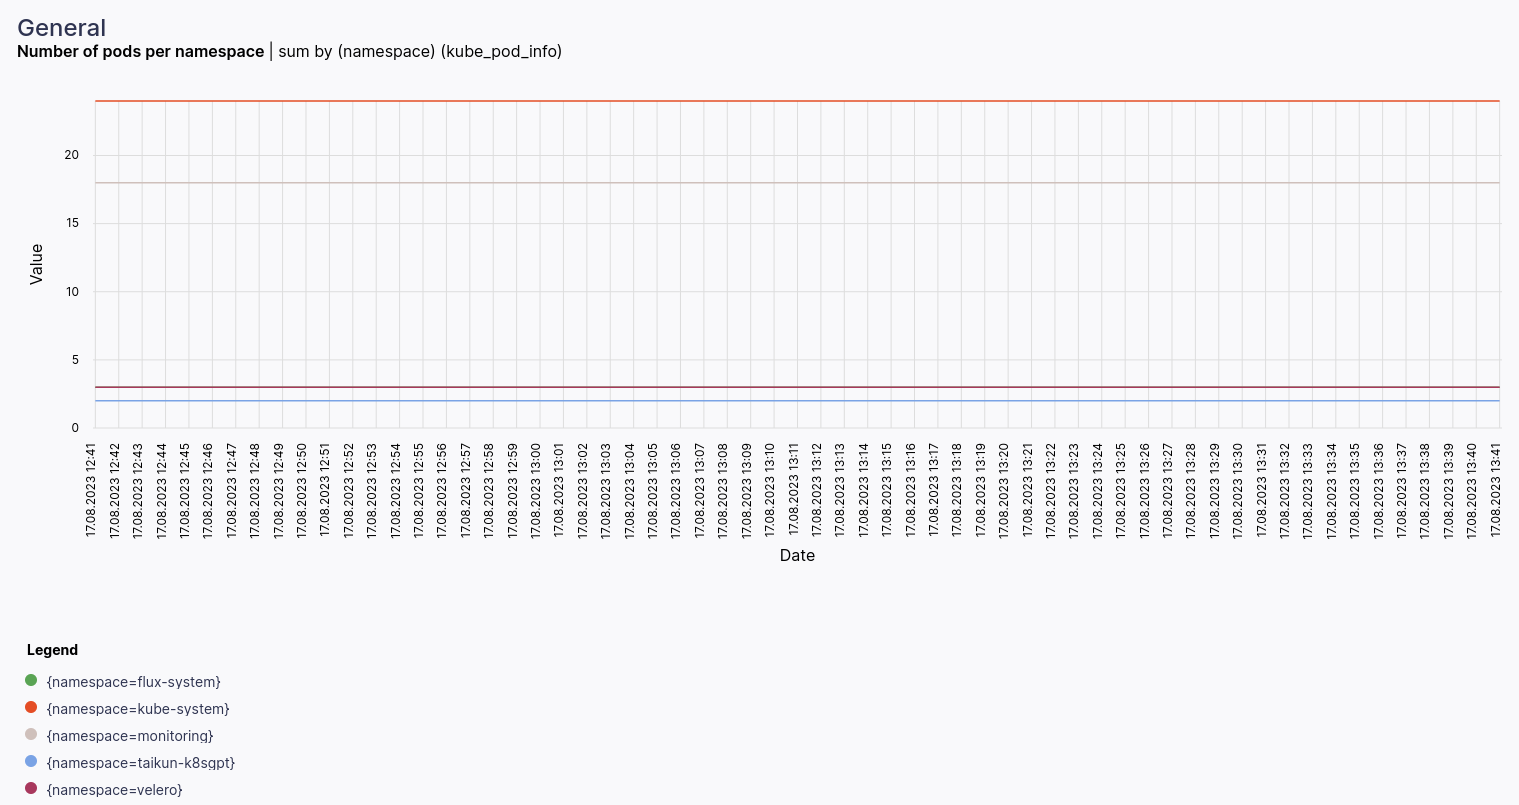
- Number of pods per namespace
This query counts the total number of pods running in each namespace of the cluster.
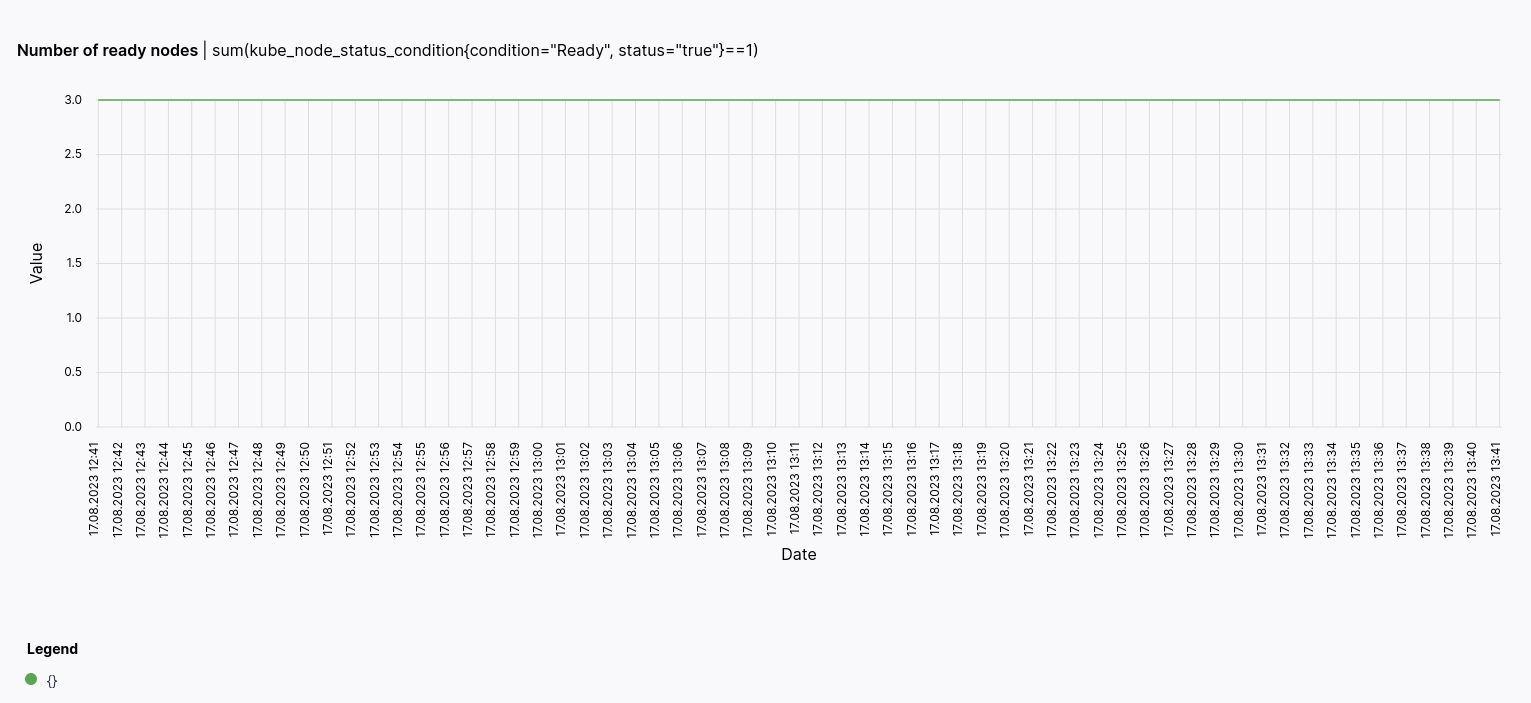
- Number of ready nodes
Calculates the number of ready nodes in each namespace of the cluster.
Pods
Show the status of pods within the project, including their current state, restart counts, and resource usage.
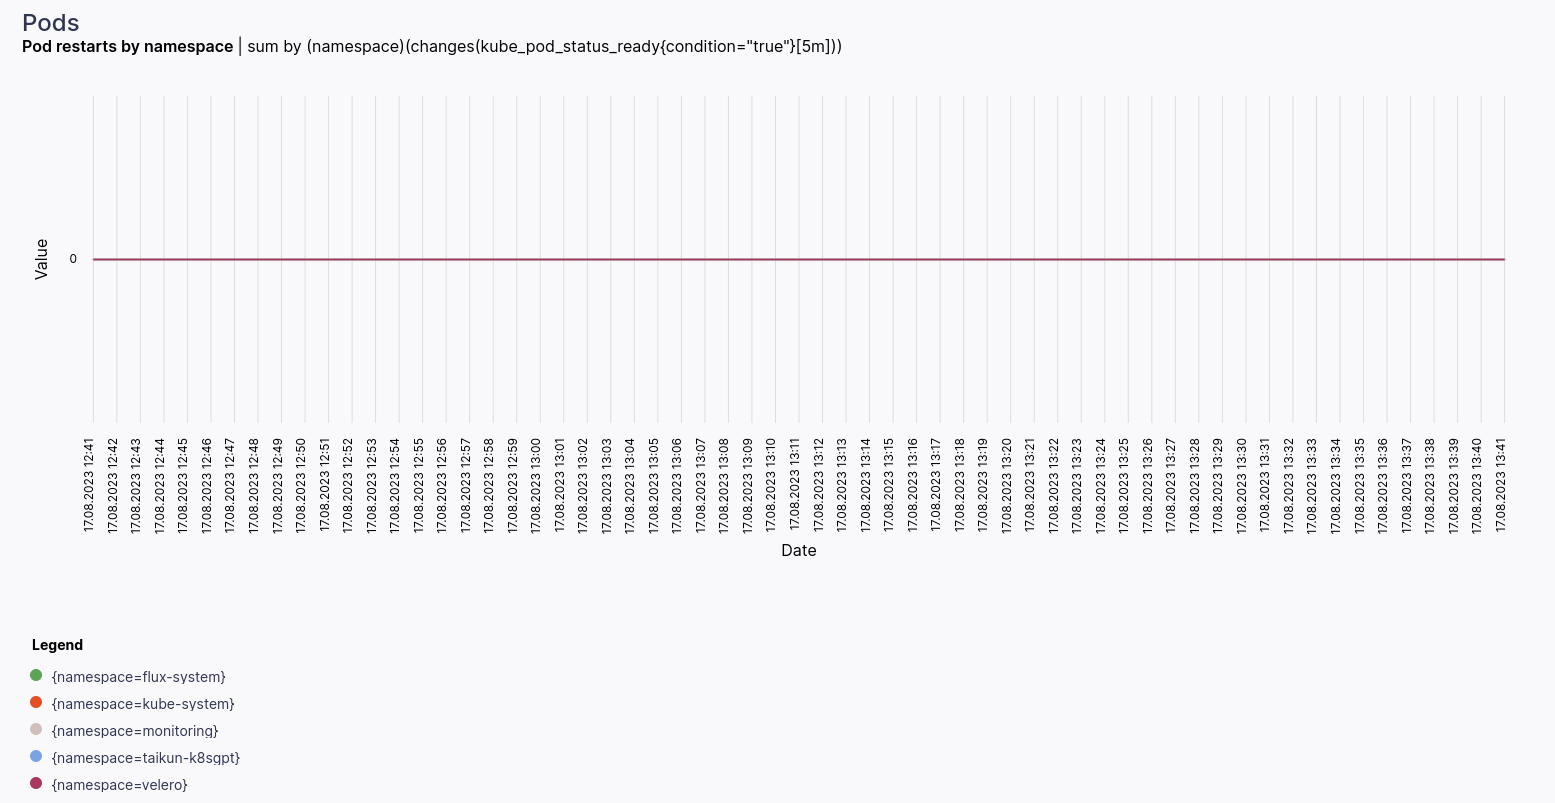
- Pod restarts by namespace
This metric indicates the cumulative count of restarts for each pod and container in your Kubernetes cluster.
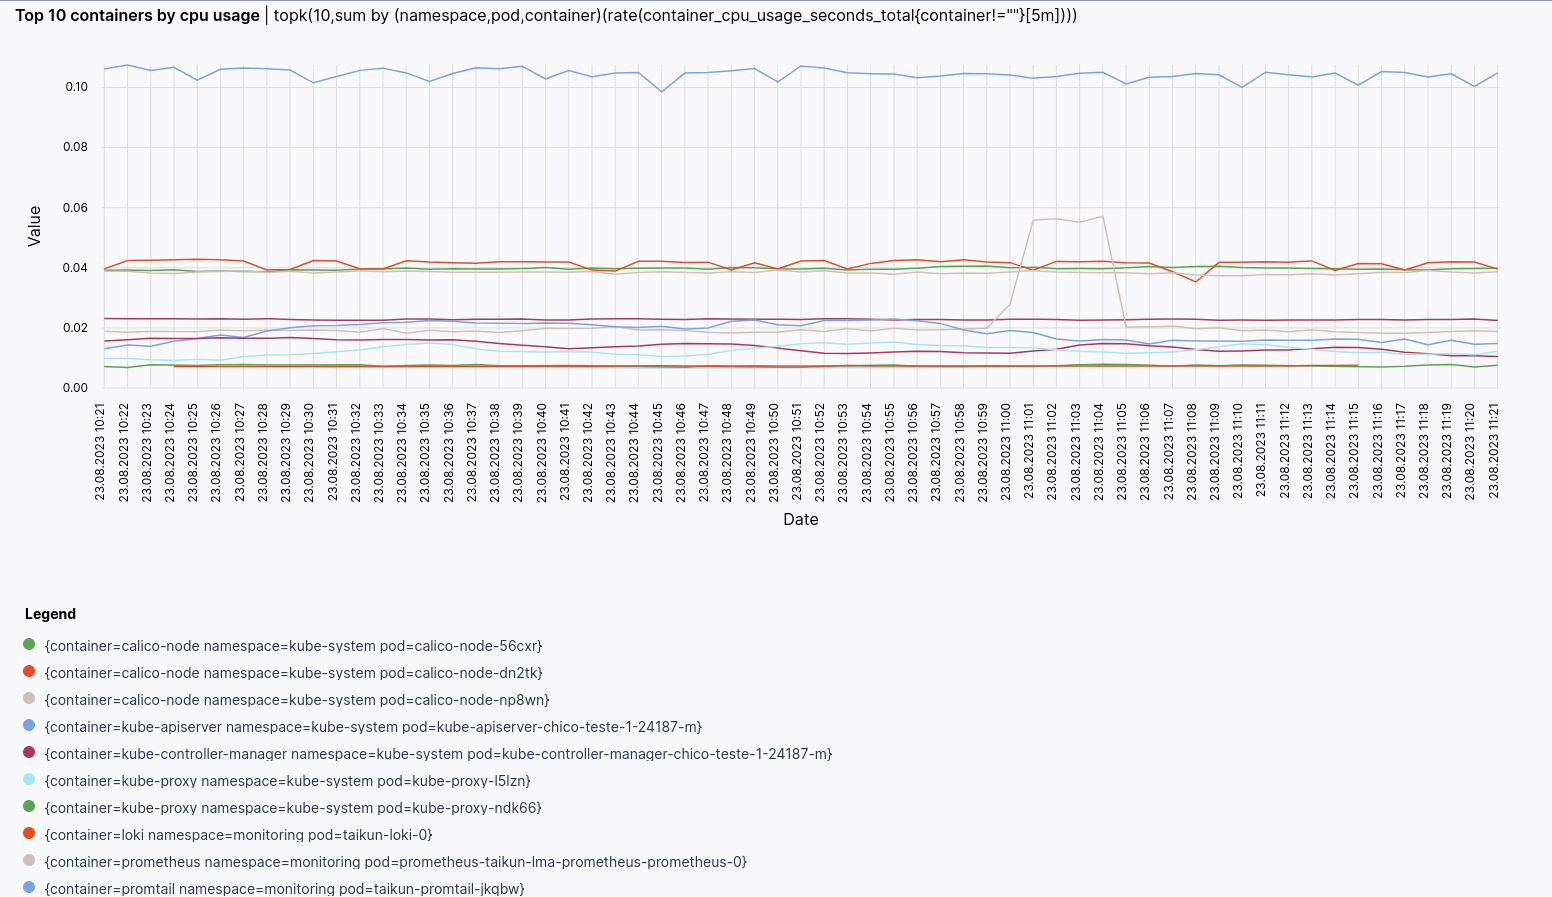
- Top 10 containers by CPU usage
Running this query will provide you with a list of the top 10 containers based on their recent CPU usage rates.
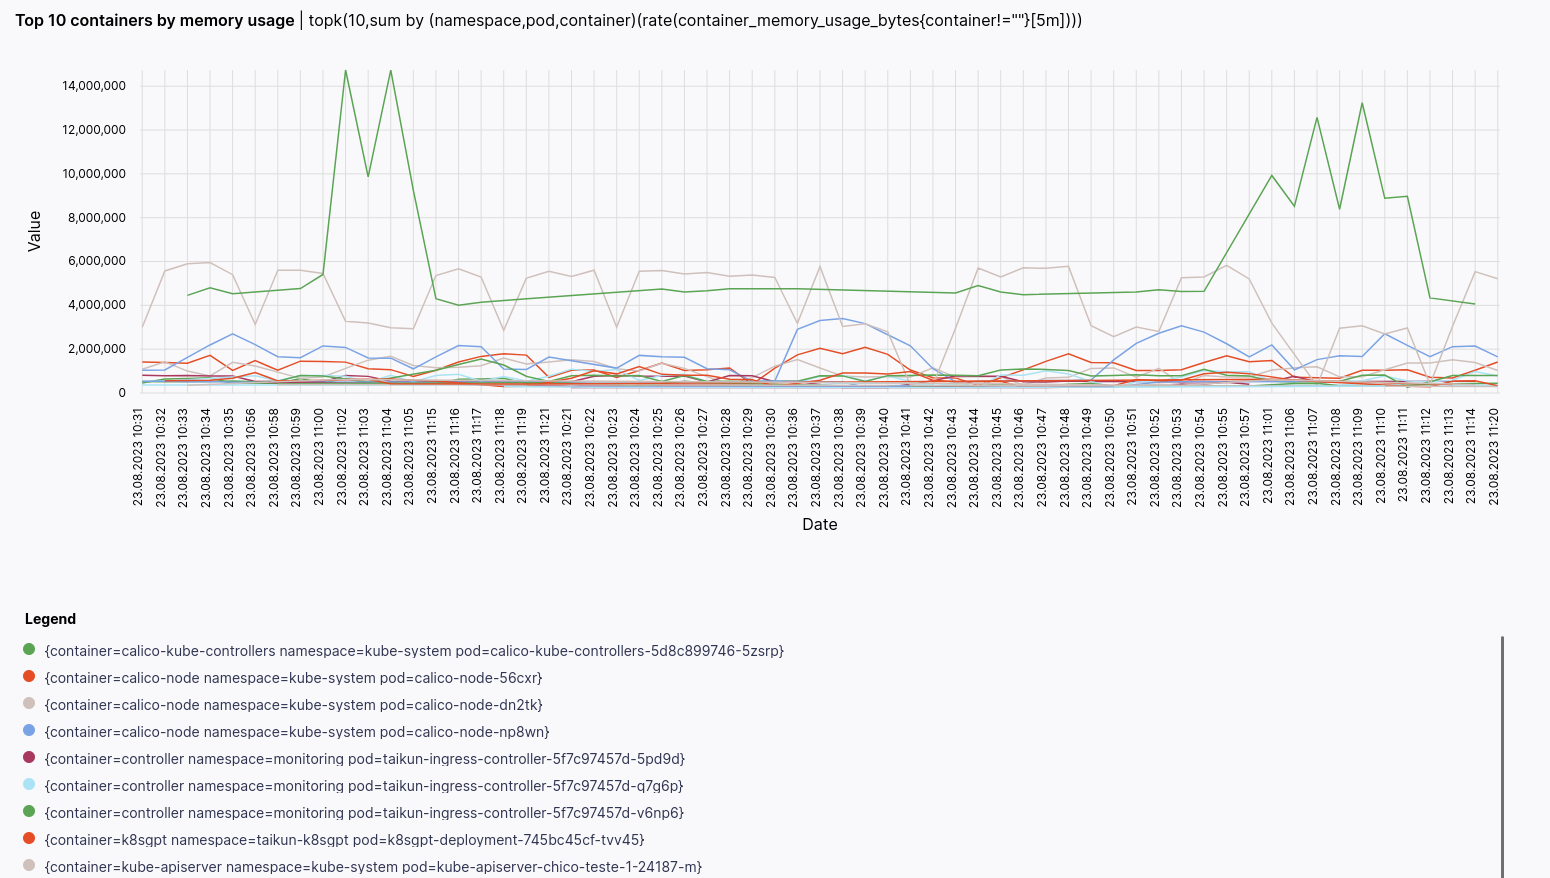
- Top 10 containers by memory usage
Running this query will provide you with a list of the top 10 containers based on their recent memory usage rates.
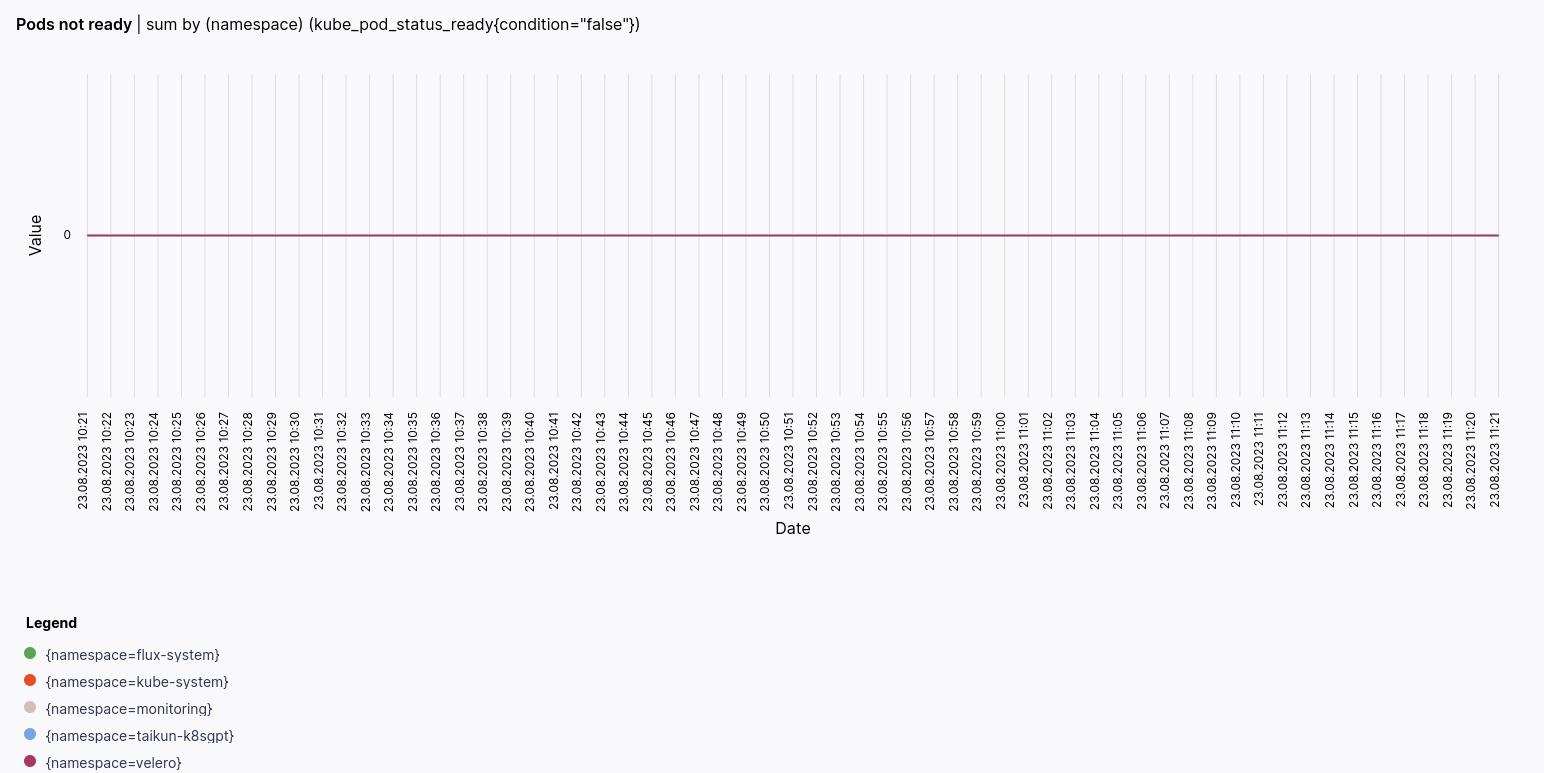
- Pods not ready
List the number of total pods not ready in each namespace.
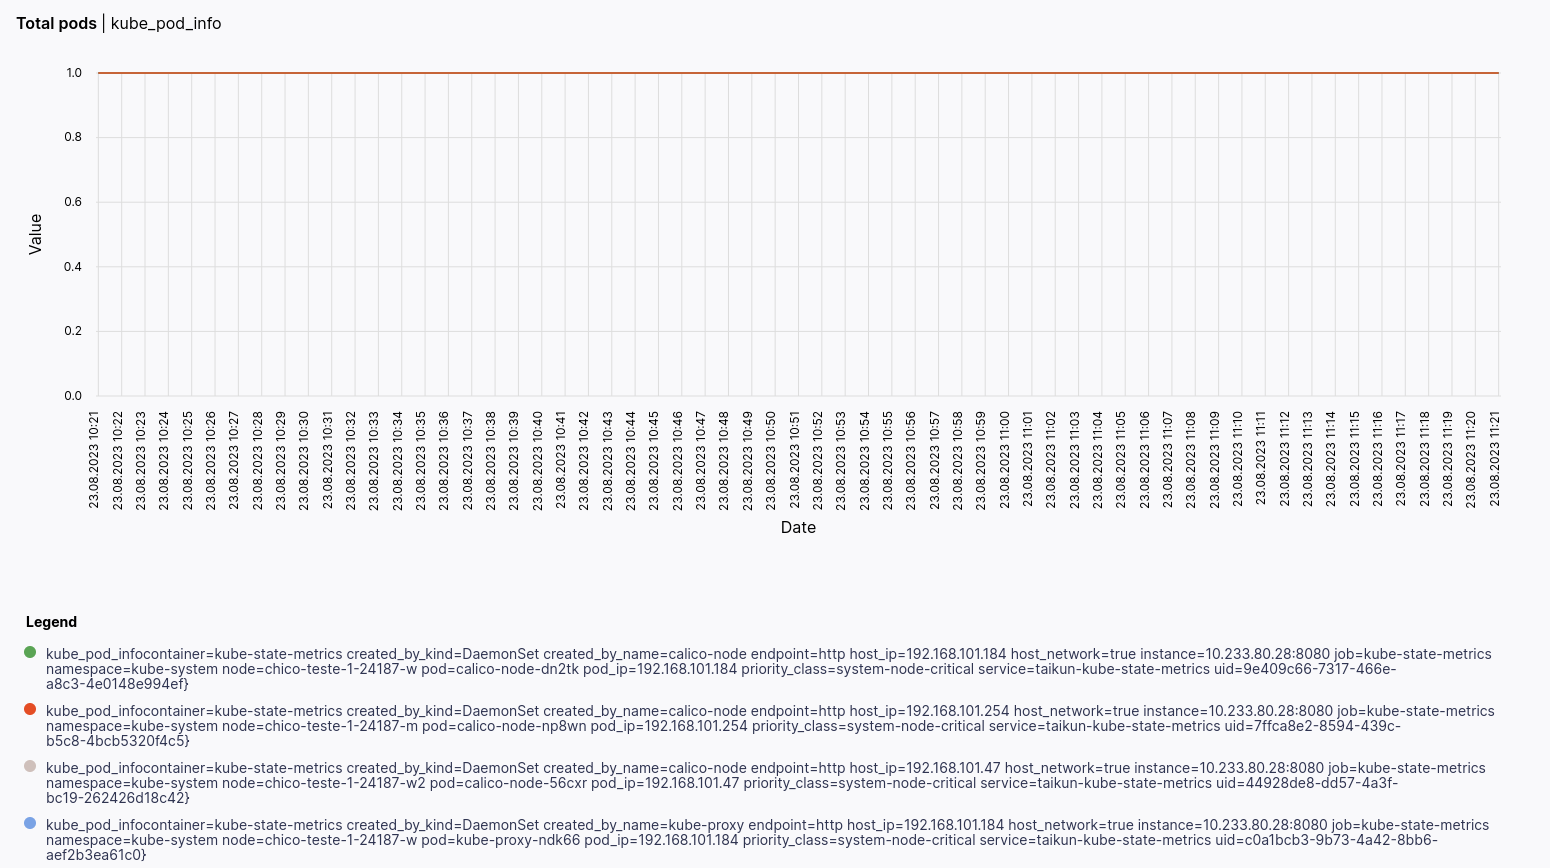
- Total pods
List the number of total pods available in each namespace.
Nodes
Display information about cluster nodes, such as CPU and memory utilization, pod count, and other relevant metrics.
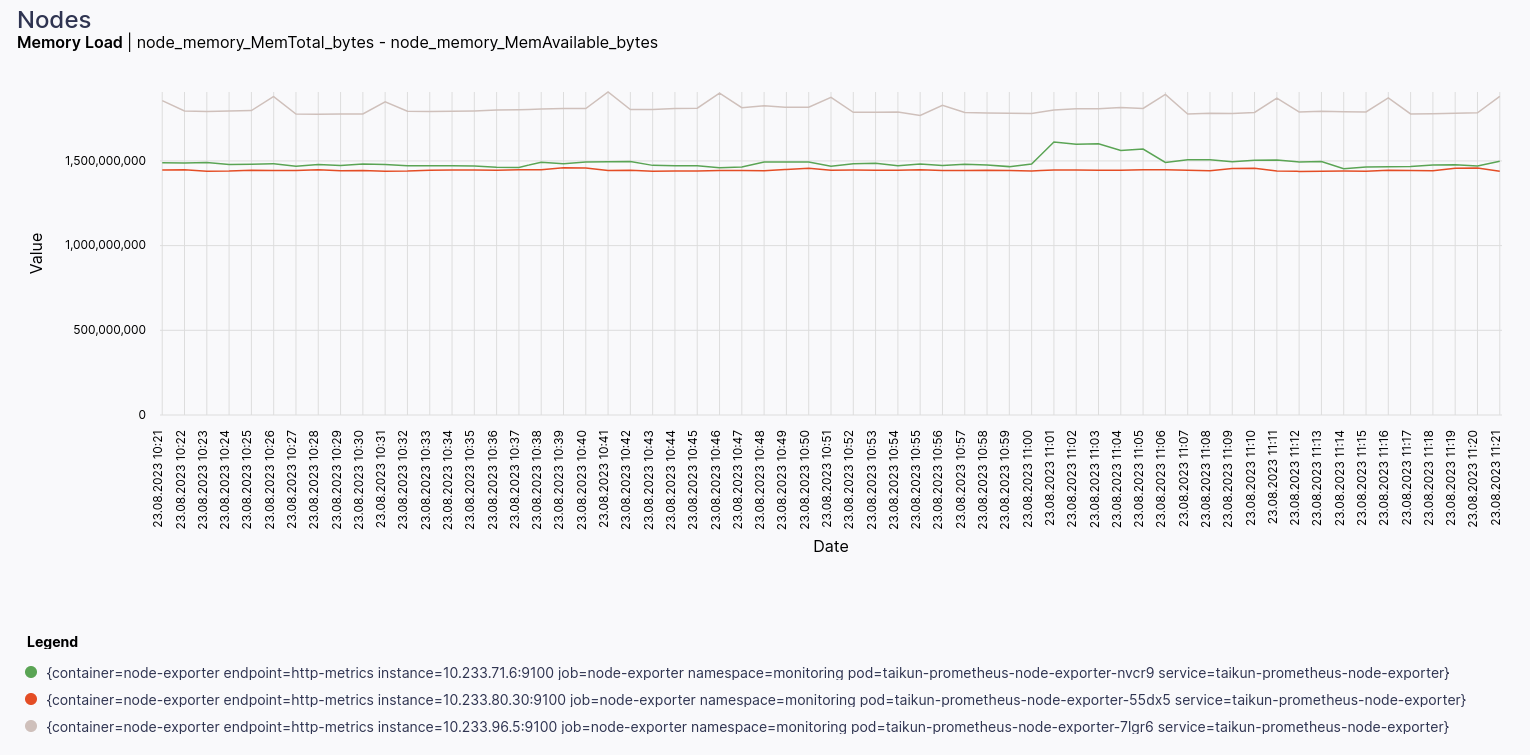
- Memory Load
The utilization of the system’s memory resources by the nodes.
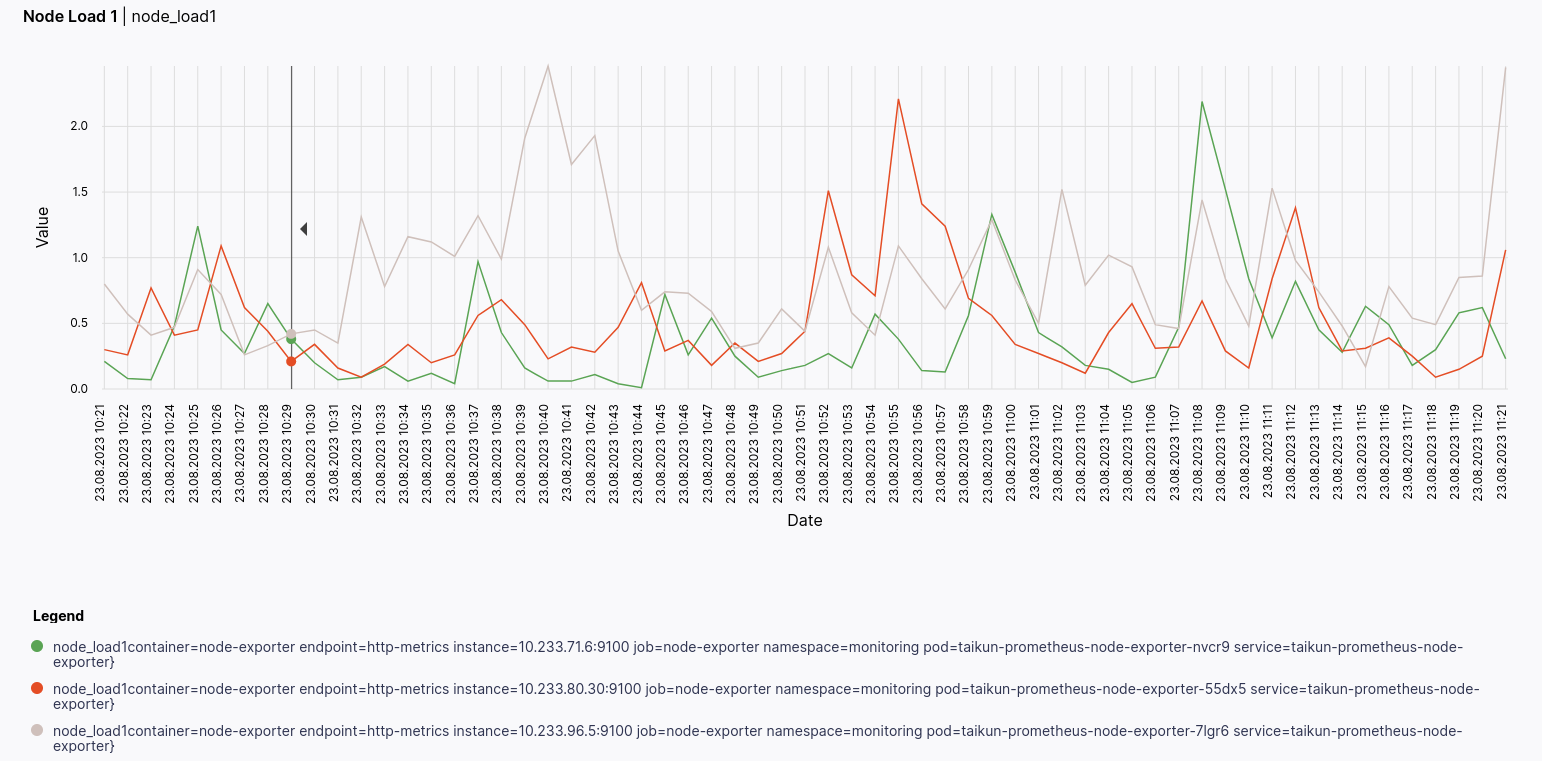
- Node Load 1
The average number of processes in the run queue or waiting for CPU time over the last 1 minute.
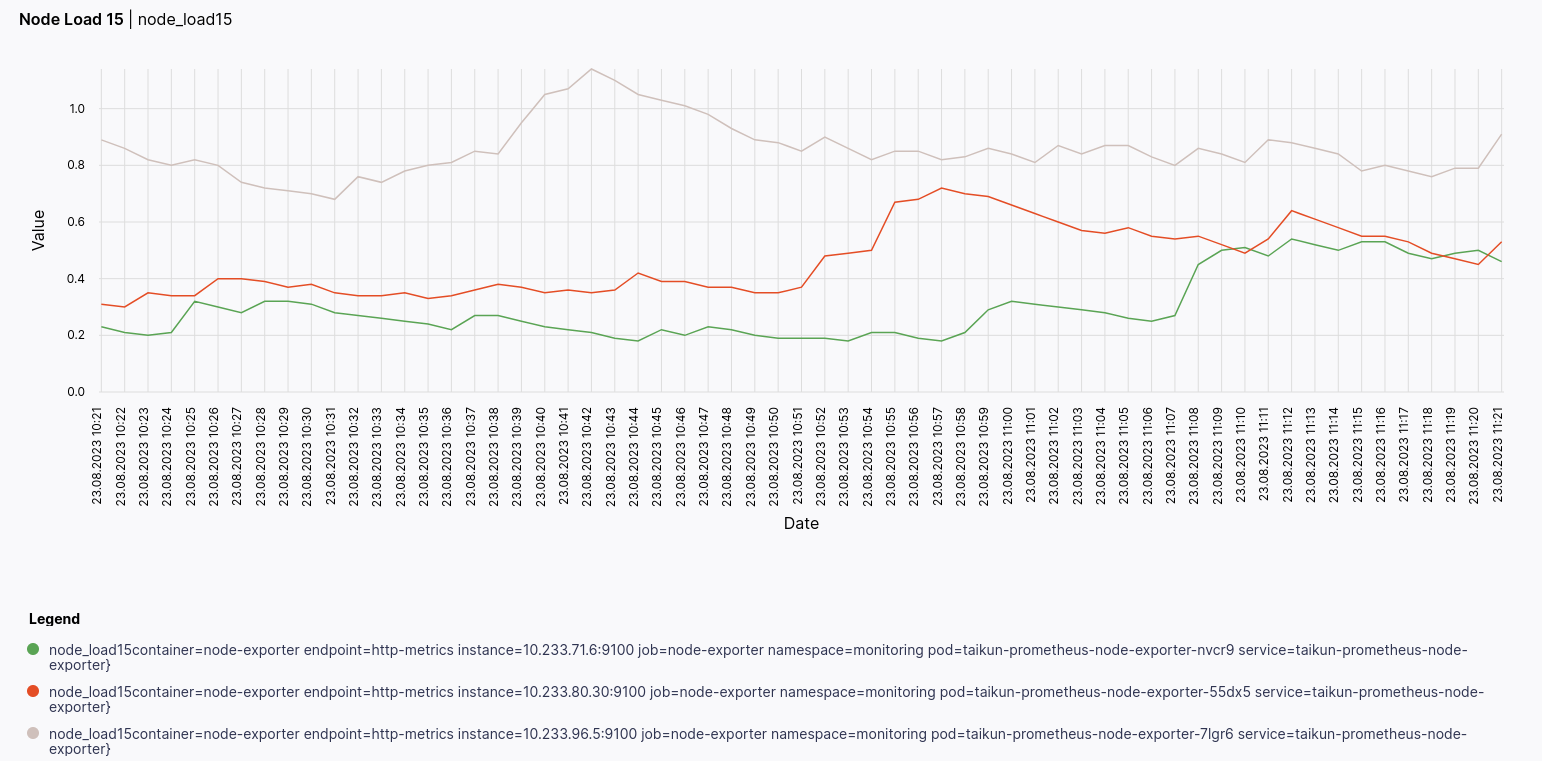
- Node Load 15
The average number of processes in the run queue or waiting for CPU time over the last 15 minutes.
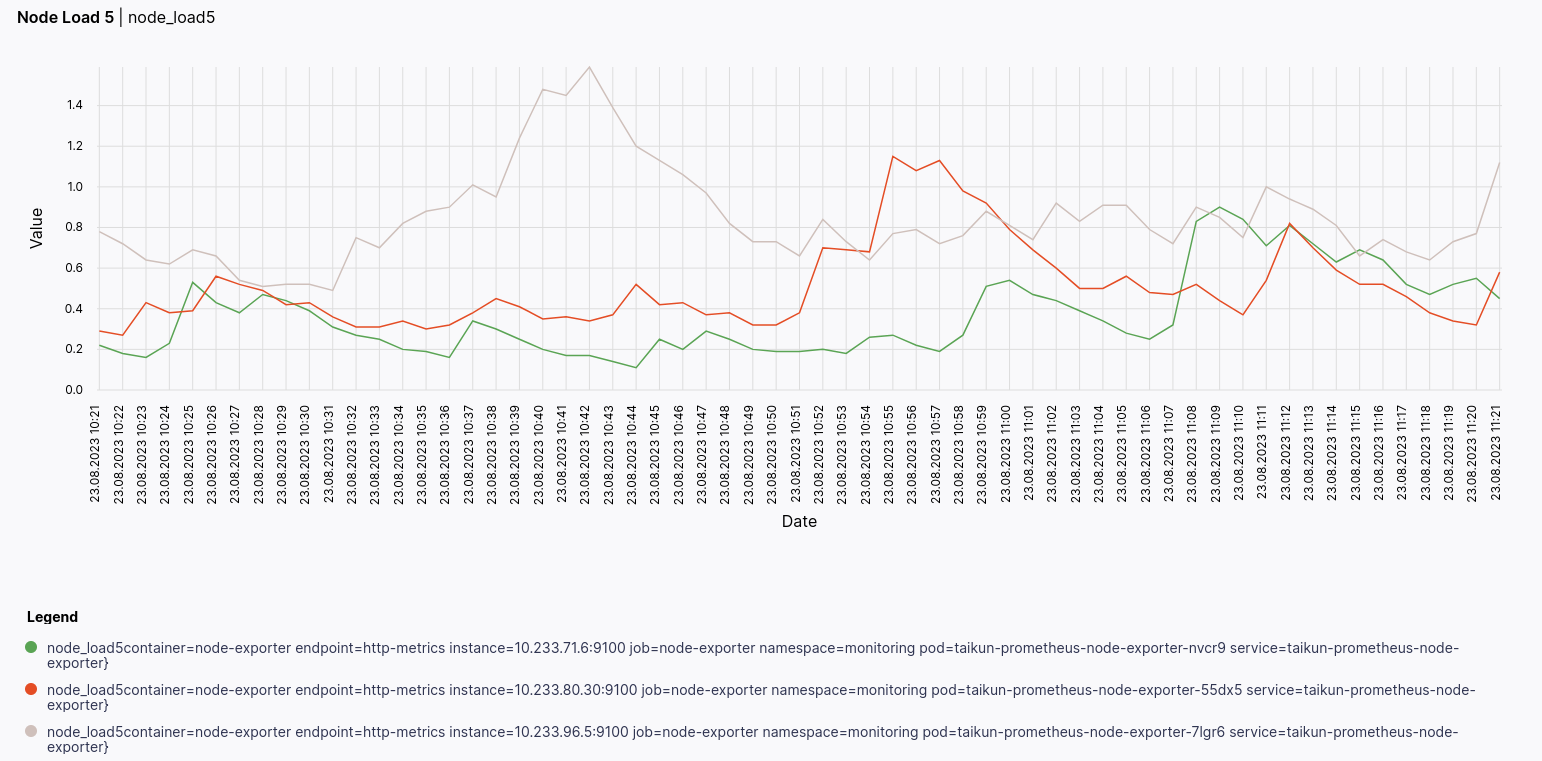
- Node Load 5
The average number of processes in the run queue or waiting for CPU time over the last 5 minutes.
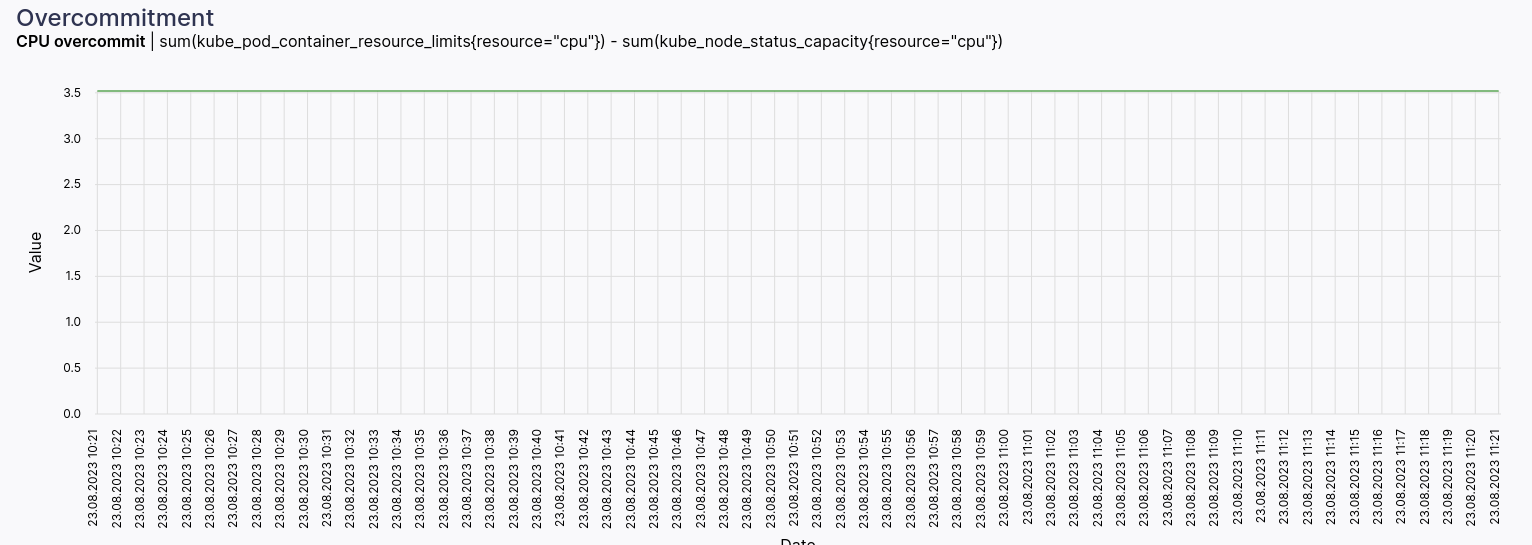
Overcommitment
CPU and Memory overcommit.
- CPU overcommit
Compares the requested CPU resources (limits) of pods to the total available CPU capacity of the cluster.
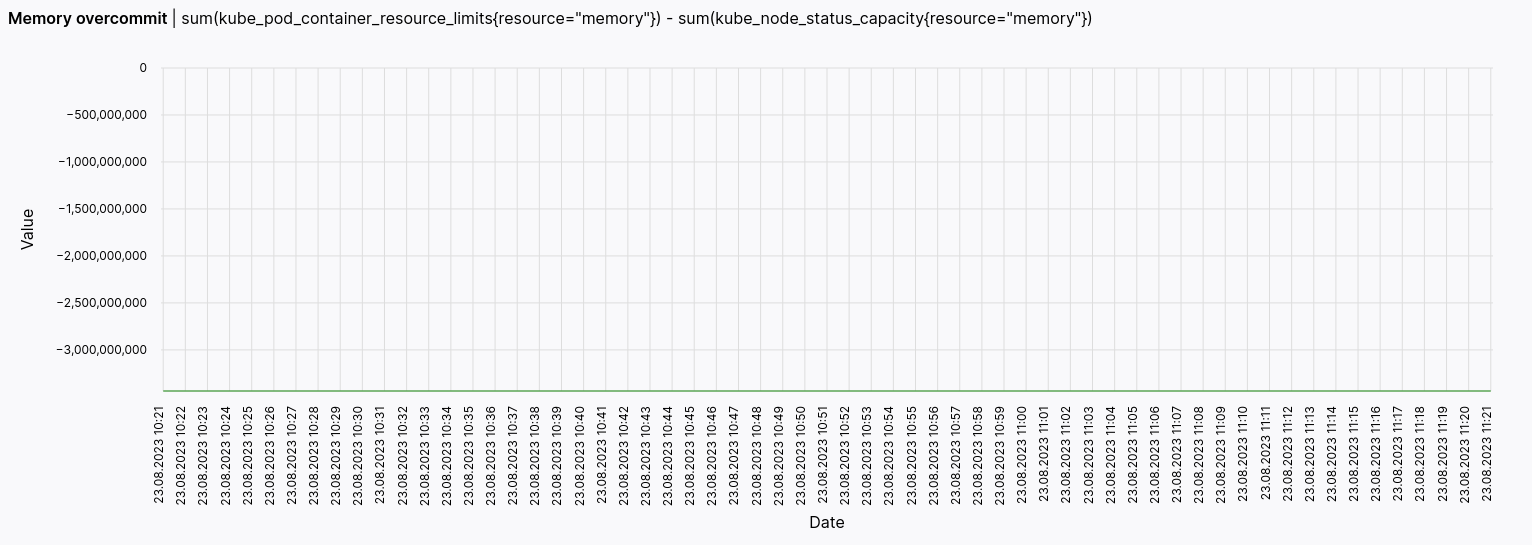
- Memory overcommit
Compares the requested memory of pods to the total available memory capacity of the cluster.
Organization Tab
The organization tab shows the list of Queries added by the user.
To add a Query:
- Click

- Name: The name of the query, which briefly describes its purpose or what it intends to retrieve.
- Expression: The actual PromQL expression that defines how to retrieve and process the metrics. This expression specifies the mathematical and logical operations to be applied to the metrics.
- Description: A brief explanation of what the query does or what kind of insight it provides. This description helps other users understand the query’s purpose and usage.
- Category name: Categories can be related to the type of metric, the aspect of monitoring, or any other relevant grouping.
- Click