


Overview
Skydive is an open source real-time network topology and protocols analyzer. It aims to provide a comprehensive way of understanding what is happening in the network infrastructure.
Skydive agents collect topology informations and flows and forward them to a central agent for further analysis. All the informations are stored in an Elasticsearch database.
Skydive is SDN-agnostic but provides SDN drivers in order to enhance the topology and flows informations.
Topology Probes
Topology probes are used to construct the graph comprising:
- Graph nodes: depicted as cycles (in contracted form) or areas (in expanded form)
- Graph edges: depicted as strait lines (with arrowheads when directional)
Agent Topology Probes
Probes which extract topological information from the host about host residing entities are agent probes:
- Docker (docker)
- Ethtool (ethtool)
- LibVirt (libvirt)
- LLDP (lldp)
- Lxd (lxd)
- NetLINK (netlink)
- NetNS (netns)
- Neutron (neutron)
- OVSDB (ovsdb)
- Opencontrail (opencontrail)
- runC (runc)
- Socket Information (socketinfo)
- VPP (vpp)
Analyzer Topology Probes
Probes which extract topological information from a remote global entity are analyzer probes:
- Istio (istio)
- Kubernetes (k8s)
- OVN (ovn)
K8s
The k8s probe provides topological information.
Graph nodes:
- general: cluster, namespace
- compute: node, pod, container
- storage: persistentvolumeclaim (pvc), persistentvolume (pv), storageclass
- network: networkpolicy, service, endpoints, ingress
- deployment: deployment, statefulset, replicaset, replicationcontroller, cronjob, job
- configuration: configmap, secret
Graph edges:
- k8s-k8s ownership (e.g. k8s.namespace – k8s.pod)
- k8s-k8s relationship (e.g. k8s.service – k8s.pod)
- k8s-physical relationship (e.g. k8s.node – host)
Graph node metadata:
- indexed fields: standard fields such as
Type,Nameplus k8s specific such asK8s.Namespace - stored-only fields: the entire content of k8s resource stored under
K8s.Extra
Graph node status:
- the
Statusnode metadata field - with values Up (white) / Down (red)
- currently implemented for resources: pod, persistentvolumeclaim (pvc) and persistentvolume (pv)
Flow Probes supported
Flow probes currently implemented :
- sFlow
- AFPacket
- PCAP
- PCAP socket
- DPDK
- eBPF
- OpenvSwitch port mirroring
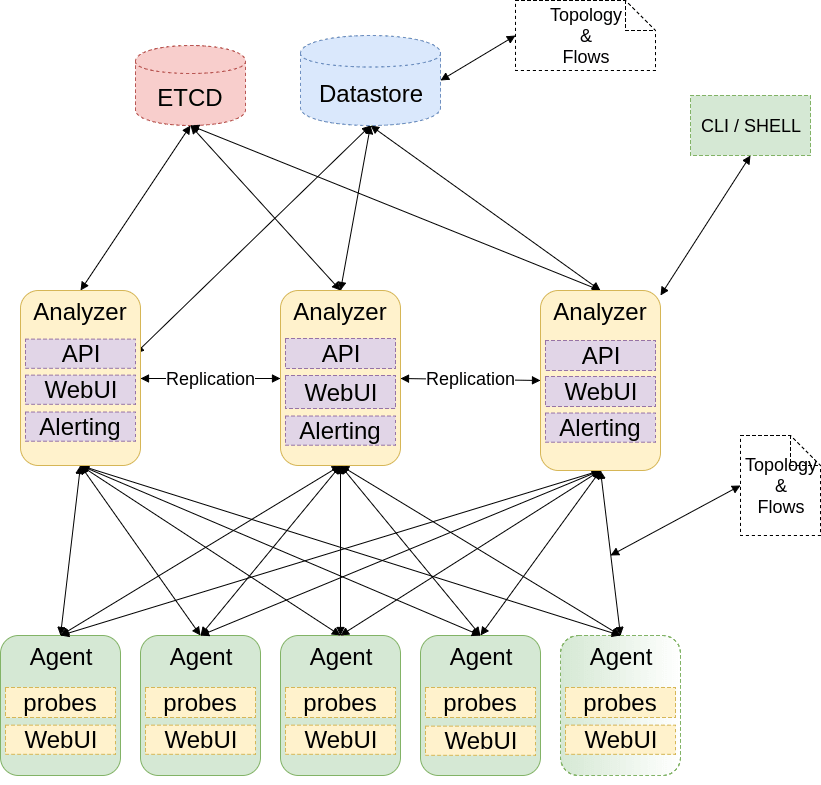
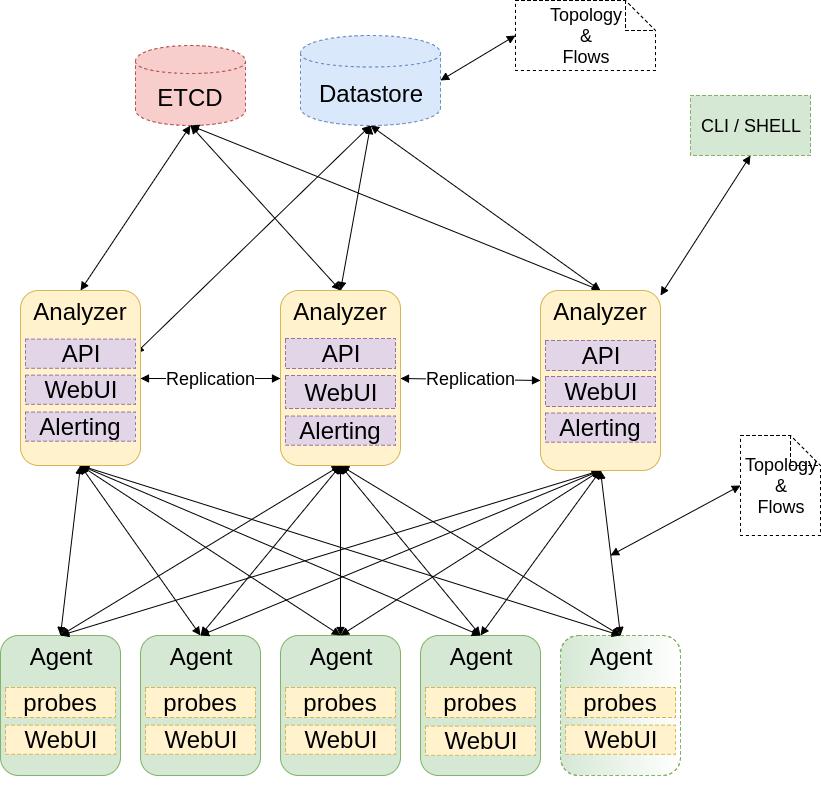
Architecture
Graph engine
Skydive relies on a event based graph engine, which means that notifications are sent for each modification. Graphs expose notifications over WebSocket connections. Skydive support multiple graph backends for the Graph. The memory backend will be always used by agents while the backend for analyzers can be choosen. Each modification is kept in the datastore so that we have a full history of the graph. This is really useful to troubleshoot even if interfaces do not exist anymore.
Topology probes
Fill the graph with topology informations collected. Multiple probes fill the graph in parallel. As an example there are probes filling graph with network namespaces, netlink or OVSDB information.
Flow table
Skydive keep a track of packets captured in flow tables. It allows Skydive to keep metrics for each flows. At a given frequency or when the flow expires (see the config file) flows are forwarded from agents to analyzers and then to the datastore.
Flow enhancer
Each time a new flow is received by the analyzer the flow is enhanced with topology informations like where it has been captured, where it originates from, where the packet is going to.
Flow probes
Flow probes capture packets and fill agent flow tables. There are different ways to capture packets like sFlow, afpacket, PCAP, etc.
Gremlin engine
Skydive uses Gremlin language as its graph traversal language. The Skydive Gremlin implementation allows to use Gremlin for flow traversal purpose. The Gremlin engine can either retrieve informations from the datastore or from agents depending whether the request is about something is the past or for live monitoring/troubleshooting.
Etcd
Skydive uses Etcd to store API objects like captures. Agents are watching Etcd so that they can react on API calls.
On-demand probes
This component watches Etcd and the graph in order to start captures. So when a new capture is created by the API on-demande probe looks for graph nodes matching the Gremlin expression, and if so, start capturing traffic.
Getting-started
There are multiple ways to easily deploy Skydive, in this section we are going to explain the most common ways.
Downloading binary
The easiest way is to download a static binary of Skydive. There are two kind of binaries, one is built each time a feature or a bug fix is available (continuous binary) , the others are provided for each release .
Since Skydive uses the same binary for all its component, one can use it as agent, analyzer or client.
All-in-One mode
This mode start an analyzer and an agent at once.
$ skydive allinone [--conf etc/skydive.yml]Agent and Analyzer separately
skydive agent [--conf etc/skydive.yml]skydive analyzer [--conf etc/skydive.yml]Client
skydive clientVagrant deployment
You can use Vagrant to deploy a Skydive environment with one virtual machine running both Skydive analyzer and Elasticsearch, and two virtual machines with the Skydive agent. This Vagrantfile, hosted in contrib/vagrant of the Git repository, makes use of the libvirt Vagrant provider] and uses Fedora as the box image.
cd contrib/vagrant
vagrant up
Docker
A Docker image is available on the Skydive Docker Hub account .
To start the analyzer :
docker run -p 8082:8082 skydive/skydive analyzerTo start the agent :
docker run --privileged --pid=host --net=host -p 8081:8081 \
  -e SKYDIVE_ANALYZERS=localhost:8082 \
  -v /var/run/docker.sock:/var/run/docker.sock skydive/skydive agent
Docker Compose
Docker Compose can also be used to automatically start an Elasticsearch container, a Skydive analyzer container and a Skydive agent container. The service definition is located in the contrib/docker folder of the Skydive sources.
docker-compose upOpenstack/Devstack
Skydive provides a DevStack plugin that can be used in order to have Skydive Agents/Analyzer set up with the proper probes by DevStack.
For a single node setup adding the following lines to your local.conf file should be enough.
enable_plugin skydive https://github.com/skydive-project/skydive.git

enable_service skydive-agent skydive-analyzer
The plugin accepts the following parameters:
# Address on which skydive analyzer process listens for connections.
# Must be in ip:port format
#SKYDIVE_ANALYZER_LISTEN=

# Configure the skydive analyzer with the etcd server address
# IP_ADDRESS:12379
#SKYDIVE_ANALYZER_ETCD=

# Inform the agent about the address on which analyzers are listening
# Must be in ip:port format
#SKYDIVE_ANALYZERS=

# ip:port address on which skydive agent listens for connections.
#SKYDIVE_AGENT_LISTEN=

# The path for the generated skydive configuration file
#SKYDIVE_CONFIG_FILE=

# List of agent probes to be used by the agent
# Ex: netns netlink ovsdb
#SKYDIVE_AGENT_PROBES=

# Remote port for ovsdb server.
#SKYDIVE_OVSDB_REMOTE_PORT=6640

# Set the default log level, default: INFO
#SKYDIVE_LOGLEVEL=DEBUG

# List of public interfaces for the agents to register in fabric
#SKYDIVE_PUBLIC_INTERFACES="devstack1/eth0 devstack2/eth1"
The classical two nodes deployment
Inside the devstack folder of the Skydive sources there are two local.conf files that can be used in order to deployment two Devstack with Skydive. The first file will install a full Devstack with Skydive analyzer and agent. The second one will install a compute Devstack with only the skydive agent.
For Skydive to create a TOR object that links both Devstack, add the following line to your local.conf file :
SKYDIVE_PUBLIC_INTERFACES="devstack1/eth0 devstack2/eth1"where devstack1 and devstack2 are the hostnames of the two nodes followed by their respective public interface.
Skydive will be set with the probes for OpenvSwitch and Neutron. It will be set to use Keystone as authentication mechanism, so the credentials will be the same than the admin.
Client & WebUI
Client
Skydive client can be used to interact with Skydive Analyzer and Agents. Running it without any command will return all the commands available.
skydive client
Usage:
  skydive client [command]

Available Commands:
  alert         Manage alerts
  capture       Manage captures
  inject-packet Inject packets
  pcap          Import flows from PCAP file
  query         Issue Gremlin queries
  shell         Shell Command Line Interface
  status        Show analyzer status
  topology      Request on topology [deprecated: use 'client query' instead]
  user-metadata Manage user metadata

Flags:
      --analyzer string   analyzer address
  -h, --help              help for client
      --password string   password auth parameter
      --username string   username auth parameter

Global Flags:
  -c, --conf stringArray        location of Skydive configuration files, default try loading /etc/skydive/skydive.yml if exist
  -b, --config-backend string   configuration backend (defaults to file) (default "file")

Use "skydive client [command] --help" for more information about a command.
Specifying the subcommand will give the usage of the subcommand.
$ skydive client capture
Manage captures

Usage:
  skydive client capture [command]

Available Commands:
  create      Create capture
  delete      Delete capture
  get         Display capture
  list        List captures

Flags:
  -h, --help   help for capture

Global Flags:
      --analyzer string         analyzer address
  -c, --conf stringArray        location of Skydive configuration files, default try loading /etc/skydive/skydive.yml if exist
  -b, --config-backend string   configuration backend (defaults to file) (default "file")
      --password string         password auth parameter
      --username string         username auth parameter

Use "skydive client capture [command] --help" for more information about a command.
If an authentication mechanism is defined in the configuration file the username and password parameter have to be used for each command. Environment variables SKYDIVE_USERNAME and SKYDIVE_PASSWORD can be used as default value for the username/password command line parameters.
Skydive uses the Gremlin traversal language as a topology request language. Requests on the topology can be done as following :
$ skydive client query "G.V().Has('Name', 'br-int', 'Type' ,'ovsbridge')"
[
  {
    "Host": "pc48.home",
    "ID": "1e4fc503-312c-4e4f-4bf5-26263ce82e0b",
    "Metadata": {
      "Name": "br-int",
      "Type": "ovsbridge",
      "UUID": "c80cf5a7-998b-49ca-b2b2-7a1d050facc8"
    }
  }
]
Refer to the Gremlin section for further explanations about the syntax and the functions available.
WebUI
To access to the WebUI of agents or analyzer :
http://<address>:<port>History and Datastore
Skydive can keep track of all the modifications of the topology and flows in a datastore. Skydive supports two backends: Elasticsearch and OrientDB.
In order to activate the history we need first to define the storage in the configuration file
Elasticsearch example:
storage:
  myelasticsearch:
    driver: elasticsearch
    host: 127.0.0.1:9200
Then we need to use it as topology backend:
  topology:
    backend: myelasticsearch
and as Flow backend
  flow:
    backend: myelasticsearch
Grafana
In order to use the Grafana datasource plugin we need to use a data store, please see the upper section.
A docker image with the datasource plugin available can be use as following:
docker run -d --name=grafana -p 3000:3000 skydive/skydive-grafana-datasource