
![]() User |
User |
![]() Manager |
Manager |
![]() Partner
Partner
Overview
Taikun offers a variety of tables, dashboards, and logs that allow you to monitor the performance and health of your clusters easily. These features are readily available within the application, giving you quick and easy access to information. Whether you’re looking for a high-level overview of your clusters or need to dig into the details, our monitoring features have you covered.
This article covers available Taikun features that will help you observe the state of your Kubernetes clusters. You can read more about Monitoring here.
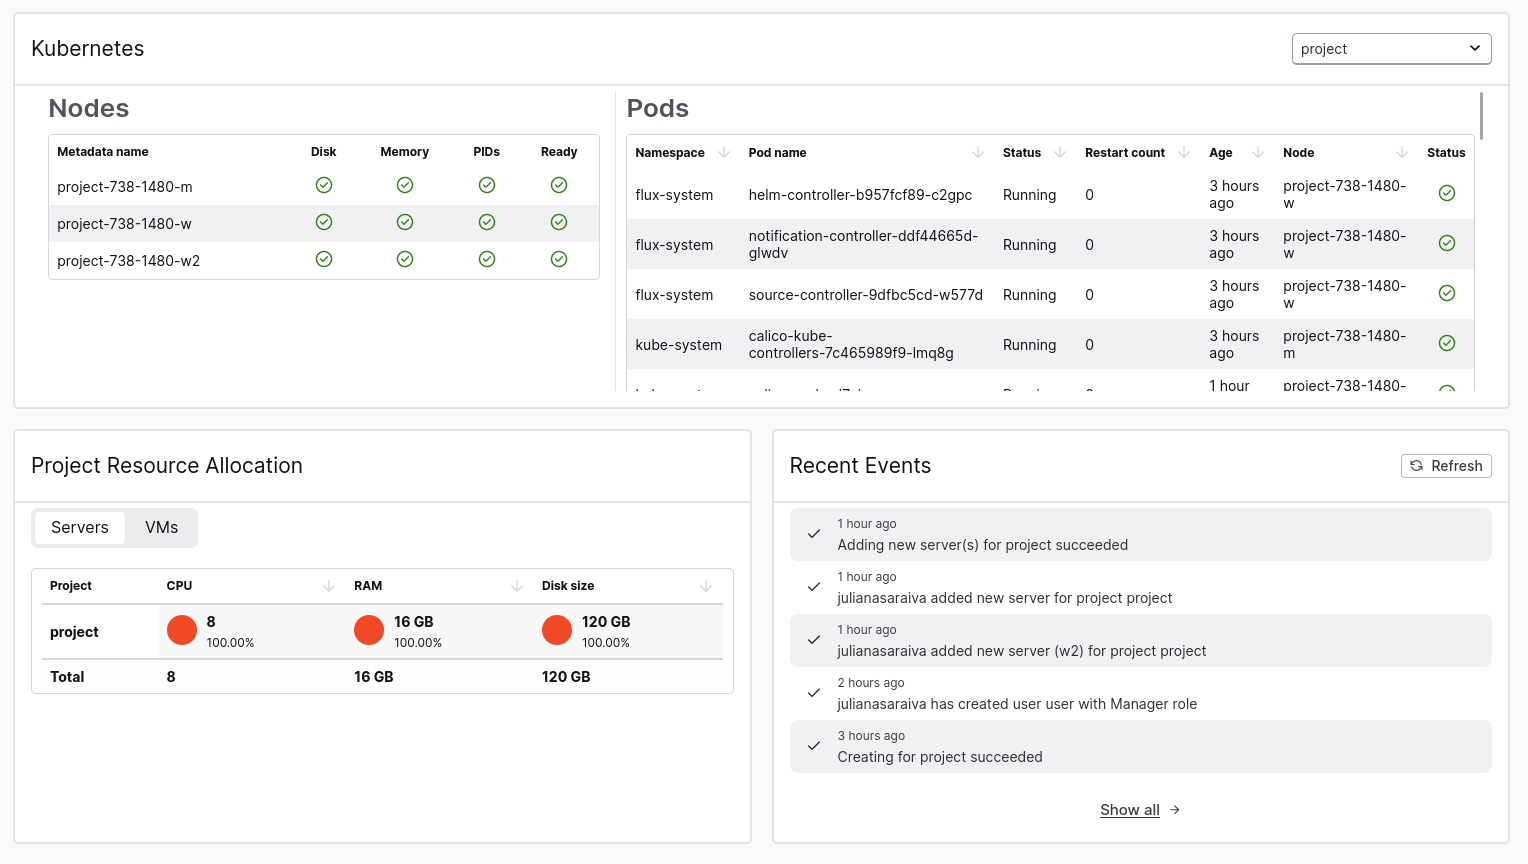
Dashboard
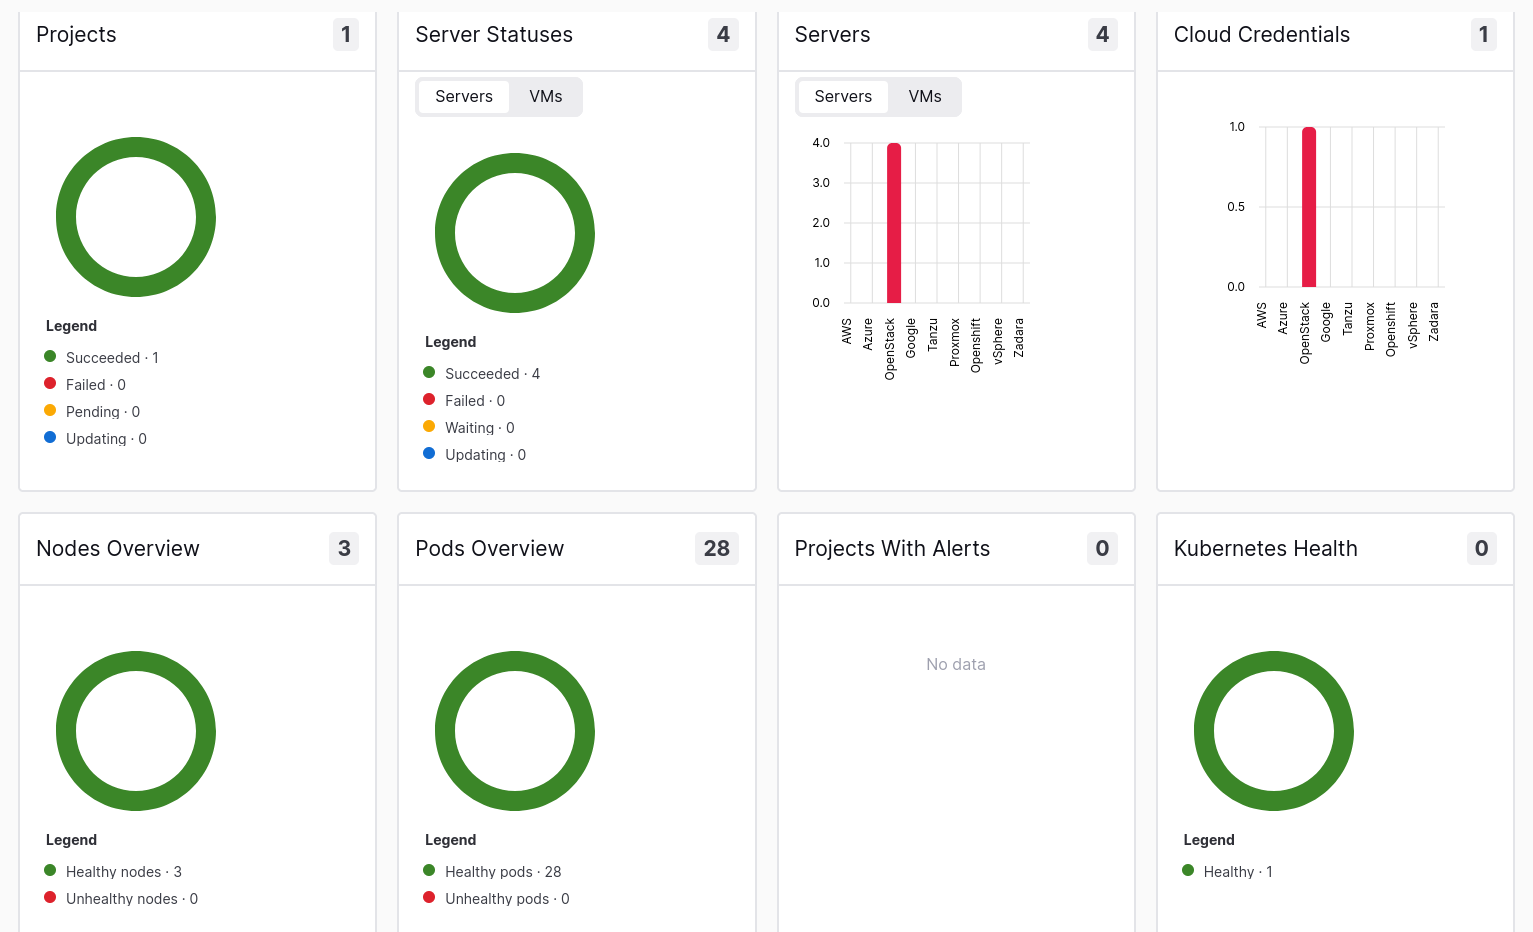
The first page you’ll see after signing into Taikun is Dashboard. With its help, you can see an overview of the state of your existing Projects.
Up here, you can find the 2 main elements for monitoring the state of your resources:
- Charts: Projects, Server Statuses, Servers, Cloud Credentials, Nodes Overview, Pod overview, Project with Alerts, and Kubernetes Health
- Tables: Kubernetes, Project Resource Allocation, and Recent Events
Our interactive Charts include the following widgets:
- Projects: this widget displays the state of your Projects via 4 statuses (Succeeded/Failed/Pending/Updating)
- Server Statuses: to dive deeper into your Projects, the widget indicates the state of each particular server in your Projects (using the same Succeeded/Failed/Pending/Updating statuses)
- Servers: this widget is a graphical representation of the number of servers running on connected Clouds
- Cloud Credentials: the number of connected Cloud services is shown here
- Nodes Overview: here you can find the state of every Node of your Projects
- Pods Overview: similarly to Nodes, this widget shows the amount of healthy/unhealthy Pods running on your servers
- Projects with Alerts: this widget indicates the number of Projects having various alerts
- Kubernetes Health: indication of the health of your Kubernetes in active Projects is shown here
With Tables, you can access more detailed information about:
- Nodes: an overview of Nodes for each particular Project that indicates the current condition of Disk, Memory, PIDs, and readiness
- Pods: detailed information on every Pod of a specified Project
- Project Resource Allocation: allocation of resources per Project
- Recent Events: log of all events related to existing Projects
Tip
All widgets presented on the page are interactive – feel free to click on any section to see detailed information
Project Function buttons
Taikun offers various services to monitor the condition of Kubernetes clusters apart from the main Dashboard menu. To access these services, you need to open a Project where you have established a Kubernetes cluster and click one of the function buttons.
There are several function buttons available, including:
- History: This button allows you to view the history of your cluster, including any changes that have been made and the date and time they were made
- K8s Info: This button provides information about your Kubernetes cluster, including details on the condition of your Nodes and Pods, Storage classes, Network Policies
- Events: This button allows you to view events that have occurred in your cluster, such as Health checks, Node registrations, and scheduling
- Logs: This button allows you to view detailed Grafana logs for your cluster
- Alerts: This button allows you to view any alerts that have been triggered in your cluster, such as if a service goes down or if there are any security issues
- Metrics: This button allows you to view metrics for your cluster with the help of Prometheus, including CPU and memory usage
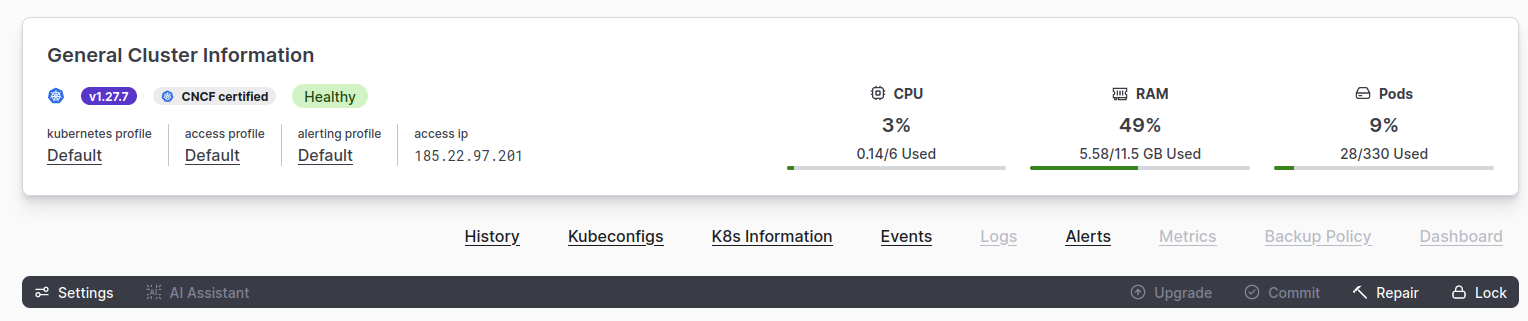
By clicking on these function buttons, you can get a deeper understanding of the condition of your Kubernetes cluster and take necessary actions to ensure it runs smoothly.
You can read about other available Settings buttons here.